


Schematic
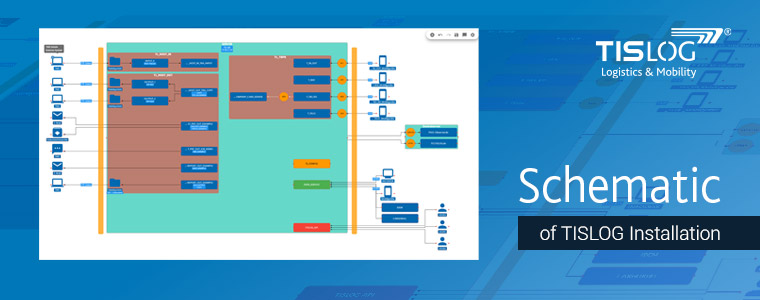
Schematic of TISLOG Installation
Bocholt, July 25, 2022
In the last year, we started with the development of a schematic which shows the particular TISLOG installation graphically. Through this, the user gets an easy overview of the infrastructure.
What does the schematic show?
The schematic is generated automatically on basis of the TISLOG installation. It gives an overview of the TISLOG (server) infrastructure and provides a presentation of the interfaces to external systems. As soon as something is changed at the infrastructure, the schematic updates itself automatically.
Presentation of detailed information
Through the graphic the user becomes important information clearly represented. That includes as an example which port is used for communication, the type of input and output (via mail, data system, short message etc.) or the current status of the server components (running/stopped). Furthermore, TIS users are able to edit or to extend the schematic. The following elements can be adjusted: the visual presentation of icons, the arrangement of the different elements and the notes such as the titles.
At the moment, the schematic can only be used by TIS users and helps them with their everyday work with the customers. In the future, the graphic should be also provided to customers. On this way, they can also get a better overview of their TISLOG installation.
Our sales team will gladly advise you!
Do you have any questions about this news or general questions about our products and services?
Our colleagues in the TIS sales gladly take care of your questions concerns.
Please give us a call:
+49 2871 2722-0
Or send us an e-mail

More News

Call us
+49 2871 2722 - 0
OFFICE HOURS
Mo-Fr 8 am - 5 pm
EVENTS
Meet TIS live
at trade shows
and other industry events